This section link is no longer available. Start from the first section.
Design a Metrics Monitoring System
Design a metrics platform that ingests server measurements, serves time-range dashboards, evaluates alert rules, and delivers reliable notifications.
Collect server metrics, show their history, and notify engineers when alert rules detect a problem.
1. Problem Statement & Scope
Build a system that stores server metrics, shows them on dashboards, and alerts engineers when a rule is triggered.
- Scale: 100,000 servers in 1,000 pools of 100.
- Metrics: CPU, memory, disk, request rate, latency, queues, custom counters, and active-server count. Use the server inventory and heartbeat signals to identify servers that are offline or not reporting.
- Access: each organization can access only its own data and notification channels.
- Scope: metric collection, storage, dashboards, and alerts. Exclude logs, traces, and automatic anomaly detection.
2. Functional Requirements
-
Accept metric batches from authenticated sources. Each sample includes a timestamp and labels that identify its source.
Example: an authenticated agent sends
metric=cpu_usage,value=72%,timestamp=2026-10-10T12:00:00Z, and labelshost=web-01,pool=payments. This records 72% CPU usage on web-01 at that time. A batch contains several such samples. -
Let users view a metric’s history for a chosen time range and source, such as CPU usage for
web-01. Return raw measurements or summaries, the time covered by each point, any missing intervals, and how recently data arrived.Example: show web-01’s average CPU from 12:00–13:00, with one point for each minute. Mark any minute with no data and show when the newest measurement arrived.
-
Let users create and change alert rules. A rule states what to measure, how often to check it, when to open an alert, when to close it, and what to do when data is missing. Save each change as a new rule version.
Example: every ten seconds, calculate web-01’s average CPU for the previous minute. Open an incident after it stays above 90% for five minutes, then resolve it when it falls below 85%. Missing data resets the five-minute wait but does not resolve an active incident.
Support M-of-N rules for nonconsecutive breaches. Example: fire if average CPU exceeds 80% in at least six of the last ten one-minute periods.
-
Send email, SMS/phone, Slack, PagerDuty, and webhook notifications. Group related alerts, allow temporary silences, retry failed sends, and escalate unresolved incidents.
-
Keep raw measurements for seven days. Keep one-minute summaries until 30 days after collection, then keep hourly summaries until 365 days after collection.
- Sample: one metric value recorded at a specific time, such as web-01 CPU at 72% at 12:00.
- Series: all samples for one metric and one source, such as CPU usage where
host=web-01. - Tenant: one organization using the platform and its own data, users, and notification channels.
- Incident: one active problem identified by an alert rule, such as “web-01 CPU is too high.” Opening an incident can create an initial notification for each configured channel. Reminders and escalations are separate actions, so an incident is not a continuously sent notification.
3. Non-Functional Requirements
The fleet size and retention periods are requirements. The performance targets below are planning assumptions. p95 means 95% of requests meet the target; p99 means 99% meet it.
| Property | Target and boundary |
|---|---|
| Intake | 40,000 samples/s sustained; initial peak assumption 120,000/s. |
| Durable acceptance | p99 under 500 ms from batch receipt until Kafka confirms replicated storage. |
| Dashboard freshness | p95 under ten seconds from batch acceptance until queries can read the data, under normal load. |
| Bounded queries | p95 under two seconds for queries within the stated limits. Large fleet scans need separate limits. |
| Alert timing | Check every ten seconds. Allow a 30-second window for out-of-order data. Evaluation also depends on stream progress and the required samples being present. |
| First notification attempt | If dependent services are operating normally, attempt the first send within 30 seconds after the firing event is committed. |
| Availability | Aim for 99.9% monthly availability for intake and bounded queries. Measure them separately and report alert-processing failures. |
| Recovery | Buffer metrics during an InfluxDB outage and catch up after recovery. Example target: for a thirty-minute outage, clear the backlog in another thirty minutes while accepting 40,000 samples/s. |
| Replay | At least 24 hours from broker append time, with sufficient disk capacity. |
4. Capacity Estimate
For sizing, assume four series per host, one sample every ten seconds, and 150 bytes per sample before compression or replication. The full metric set may need more series. Use decimal units: 1 GB = 1,000 MB.
| Estimate | Calculation |
|---|---|
| Active series | 100,000 servers × 4 tracked metric series per server = 400,000 active series. |
| Intake | 400,000 / 10 = 40,000 samples/s; 3× peak = 120,000/s. |
| Agent requests | One batch per host per interval: 10,000 requests/s. |
| Logical traffic/storage | 40,000 × 150 = 6 MB/s, or 518.4 GB/day. |
| Thirty-minute outage | 40,000 × 1,800 = 72M samples, or 10.8 GB logical backlog. |
| Catch-up | At 80,000 writes/s, net drain is 40,000/s: thirty minutes. |
| Retained history | Raw/minute/hour schedule: about 6.1 TB logical, assuming equal-sized records. |
Kafka needs enough space for outages, and writers need spare capacity to clear the backlog. Rollups keep historical storage manageable. Use load tests to choose node counts. Allow extra space and capacity for replicas, indexes, compaction, and checkpoints. At 120,000 incoming samples/s, a writer limited to 80,000/s cannot catch up.
Detailed storage and Flink-state estimates are in the appendix.
5. High-Level Architecture
Agents send metrics to ingestion, which buffers them in Kafka. Two independent paths consume these metrics: writers store them in InfluxDB for dashboard queries, while Flink evaluates alert rules. PostgreSQL stores rules, incidents, and notification jobs; notification workers deliver alerts to configured channels.
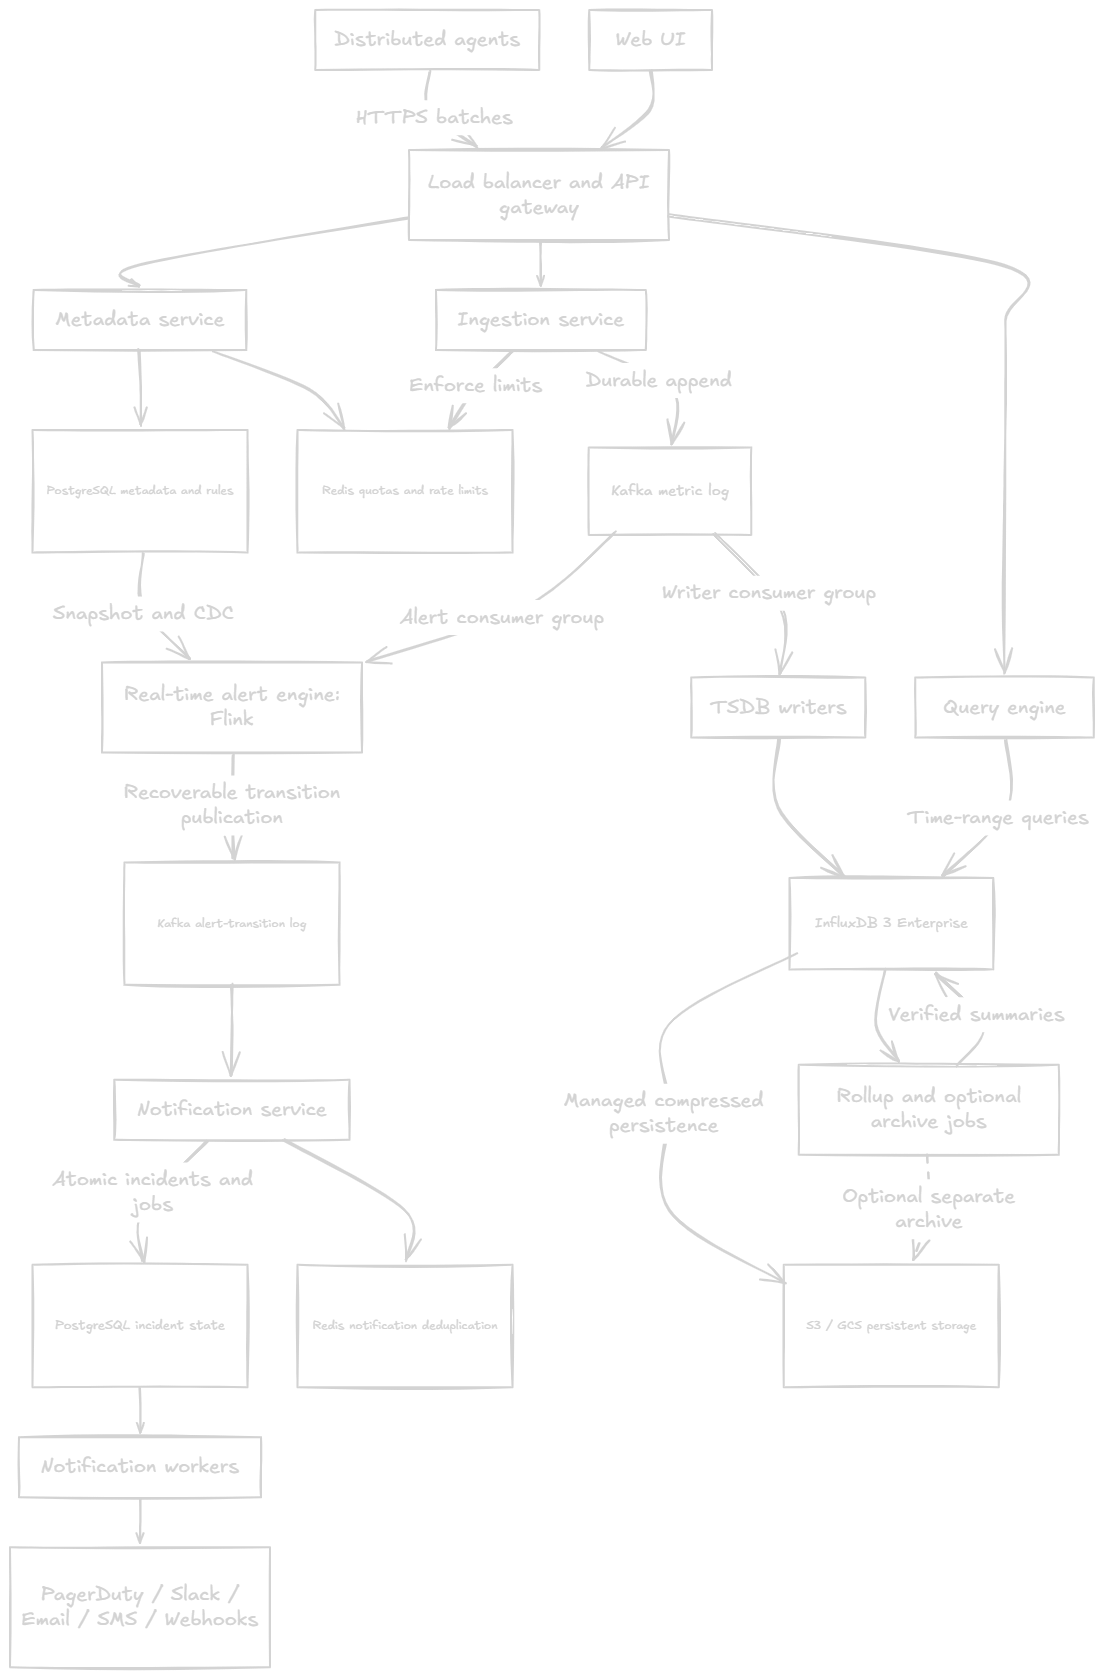
One PostgreSQL database stores metadata, rules, incidents, and delivery jobs. Kafka alert events use a separate topic in the existing Kafka system.
Save each incident and its notification jobs in one transaction, so both are saved or neither is. Workers retry unfinished jobs after a failure. Redis is an optional cache; PostgreSQL remains responsible for preventing duplicate incidents and jobs.
- Write path: agents → gateway → ingestion → Kafka → writers → InfluxDB.
- Read path: Web UI → gateway → query engine → InfluxDB.
- Rule path: Web UI → metadata service → PostgreSQL → snapshot/CDC → Flink.
- Alert path: Kafka metrics → Flink → Kafka alert events → notification service → PostgreSQL incidents/jobs → workers → providers.
- History path: InfluxDB → verified rollups and database-managed compressed persistence in S3/GCS. A separate Spark archive is optional.
InfluxDB controls how soon metrics appear on dashboards. Flink controls how soon rules evaluate them. An InfluxDB outage can delay dashboards while alerts continue. Alerts still depend on Kafka, Flink, rule updates, PostgreSQL incident storage, and notification providers.
Write path: durable intake
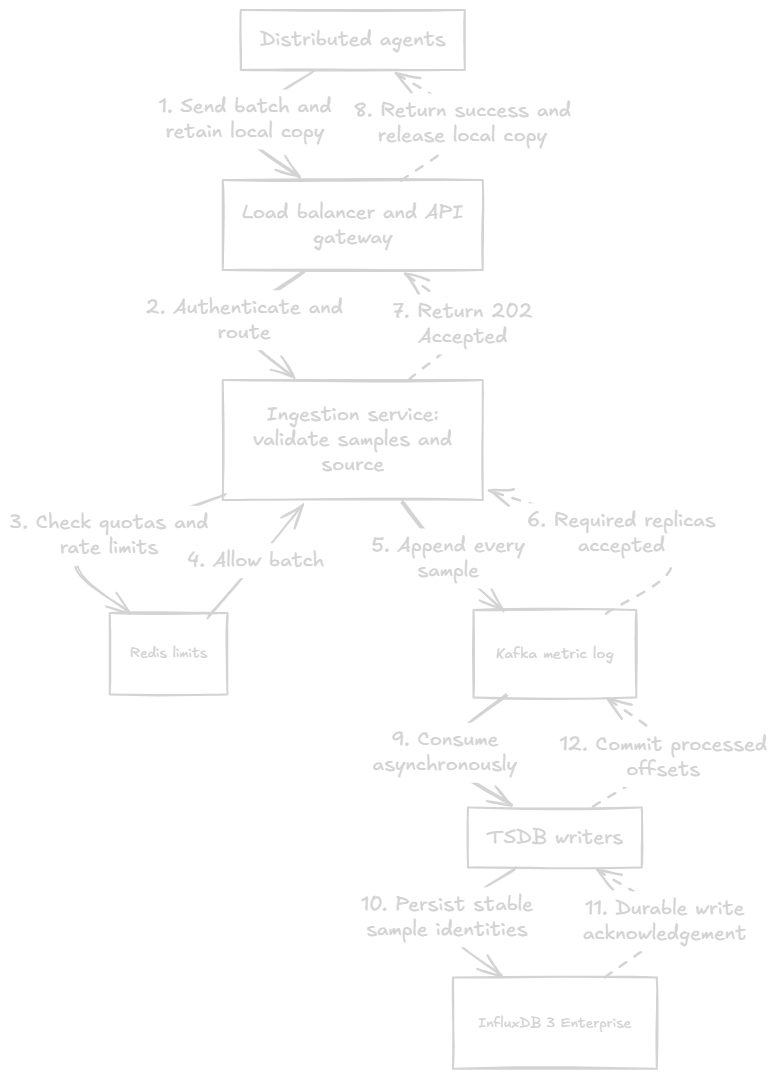
- Steps 1–4: check identity, sample format, and limits. The agent keeps its local copy; rejected batches do not proceed to append.
- Steps 5–8: return success only after Kafka durably accepts every sample. Dashboard visibility comes later. If the response is lost, retry the same sample identities and values.
- Steps 9–12: writers persist samples and then commit offsets. This branch runs independently and can overlap steps 6–8. Flink consumes through a separate group. Dashed arrows show acknowledgements and progress updates.
Read path: query metrics
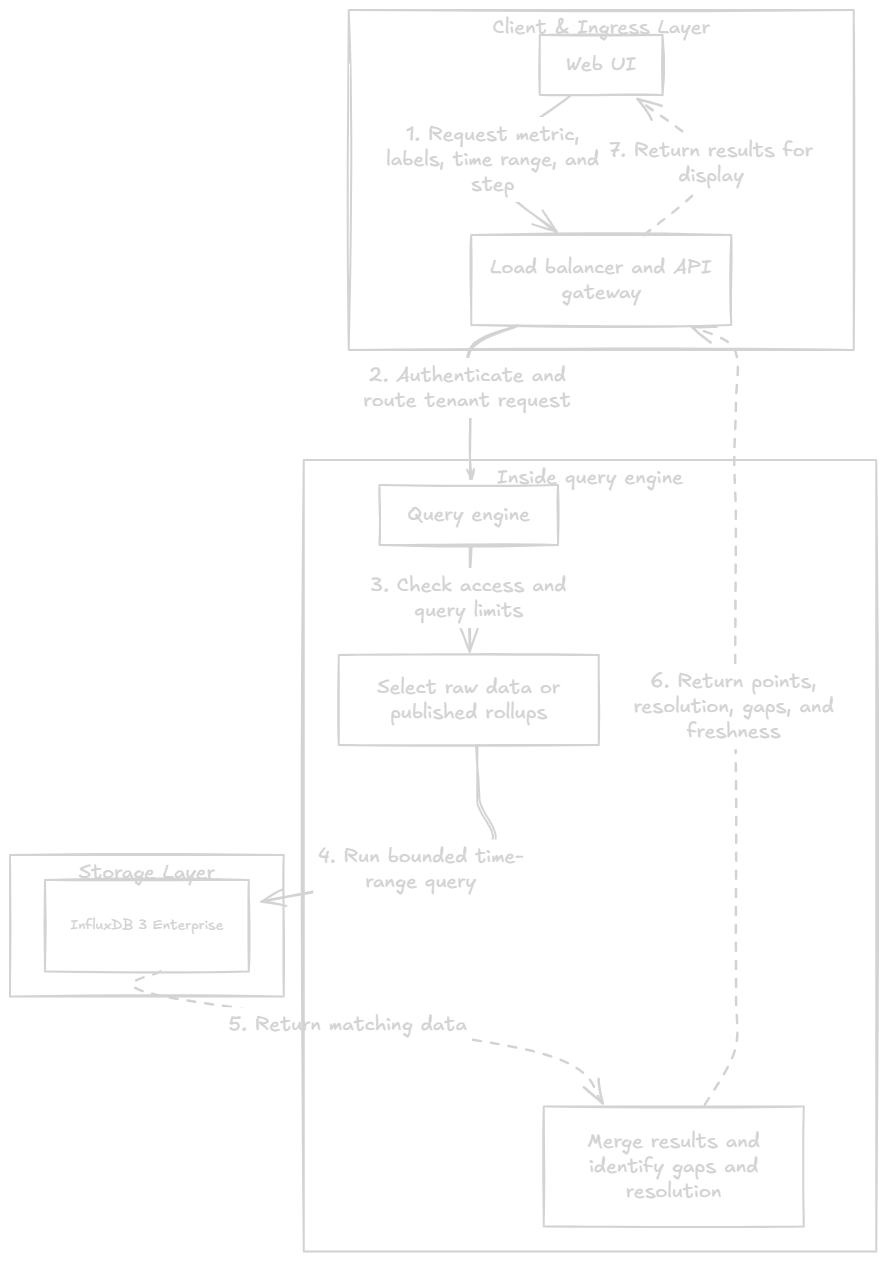
- Steps 1–3: verify tenant access and bound the query. Choose raw samples for recent detail, minute summaries for older data, or hourly summaries for long-term history.
- Steps 4–5: read matching data and combine results inside the query engine. Use only published rollups; missing data stays a gap rather than becoming zero.
- Steps 6–7: return values with resolution and freshness. Dashed arrows show the response path. Recently accepted samples may still be waiting for a writer; dashboard reads do not drive Flink’s alerts.
6. Components
| Component | Responsibility and owned state |
|---|---|
| Agent | Collect and batch samples. Keep unsent data in a size-limited buffer with its original timestamps. |
| Gateway / ingestion | Authenticate, authorize host identity, validate schema and quotas, and append to Kafka. The gateway alone provides no durability. |
| Kafka | Replicated metric records and replay; separate writer and Flink consumer progress. Also buffers alert transitions. |
| InfluxDB writer | Reads accepted metrics from Kafka and writes them to InfluxDB in batches for dashboard queries. After a failure, it retries with the same sample identity and value. It records its Kafka progress only after InfluxDB confirms the write, so no accepted metric is skipped. |
| InfluxDB | A time-series database for storing and querying metric data. It stores raw metrics and downsampled rollups for time-range queries. A write-ahead log protects recent writes, while compression and compaction reduce storage use and organize data files. |
| Query engine | Tenant scope, label selection, resolution choice, query limits, and partial-result reporting. |
| Metadata service / PostgreSQL | The source of truth for organizations, users, monitored hosts, dashboards, alert rules, notification channels, incidents, and delivery jobs. The service saves each rule change as a new version and uses PostgreSQL transactions to keep related incident and notification records consistent. |
| Flink | A stream processor that reads metrics from Kafka and evaluates alert rules continuously. It keeps the recent measurements needed for each rule, tracks breach duration and M-of-N results, handles missing data, and emits an incident transition when a rule fires or resolves. Its checkpoints let it resume this work after a failure. |
| Redis | Coordinated rate limits and notification deduplication/grouping caches; optional dashboard cache. |
| Notification service | Check for duplicate alert events. Save incidents and jobs together, apply grouping and silences, and send queued notifications. |
| Rollup jobs / S3 or GCS | Publish verified summaries before expiry; persist compressed history through the supported database or archive path. |
Each component should have a clear responsibility, even if several APIs run in one process. Scale ingestion, queries, Flink, and notification workers separately when their workloads differ.
7. Data Model & Storage Design
One measurement, one identity
A metric retry must represent the same measurement, not create a second one. Identify each sample by its organization, metric name, source labels, and measurement time:
(tenant, metric, labels, timestamp)
For example, CPU usage of 72% on web-01 in the payments pool at 12:00 belongs to:
(acme, cpu_usage, host=web-01 + pool=payments, 12:00:00)
- Use the same label names, values, order, and units every time. One authorized producer should write each series.
- If an agent retries because it did not receive a response, it must send the same timestamp and value. The batch ID identifies the request; the sample identity identifies the measurement.
- InfluxDB uses the metric table, tags, and timestamp to identify a point. Retrying the same value is safe. A changed value needs a separate correction process because conflicting writes are unreliable.
Where data lives
| Store | What it stores | Why it is needed |
|---|---|---|
| Kafka | Accepted metric records and alert-transition events for a limited replay period. | It is the durable intake boundary. Writers and Flink can read the same metrics independently and recover by replaying them. |
| InfluxDB | Raw measurements and published minute/hour summaries. | It serves dashboard history. New data appears after writers consume it from Kafka. |
| PostgreSQL | Organizations, users, monitored hosts, dashboards, rule versions, notification channels, incidents, and delivery jobs. | It is the source of truth for data that must change together, such as an incident and its required notification jobs. |
| Flink managed state | State held inside the real-time alert engine (Flink) shown in the diagram: rule copies received through CDC, recent Kafka measurements, evaluation timers, M-of-N breach history, and duplicate checks. | Flink uses it to evaluate each alert continuously. A checkpoint saves this state with Flink’s Kafka progress, so it can resume after a failure without losing the evaluation context. |
| Redis | Rate-limit counters and temporary caches for notification grouping or duplicate checks. | It speeds up frequent checks, but no incident or unfinished notification can depend only on Redis. |
Technology choice: InfluxDB provides metric storage, compression, and analytical queries. PostgreSQL stores metadata that must change together in a transaction. S3/GCS stores persistent files; queries still run through the database or an archive query service.
8. APIs
| API | Purpose | Request and response |
|---|---|---|
POST /v1/metrics | Submit a batch of metric samples. | Authenticated batch ID and samples containing metric, type, timestamp, value, and labels. Return 202 Accepted only after the durable log accepts every sample. |
GET /v1/metrics/query | Read metric history for a dashboard. | Expression, from/to, and output step. Return ordered points, actual interval and resolution, gaps, and freshness. Include from, exclude to, and limit query work. |
POST /v1/alert-rules | Create a rule that detects a problem. | Expression, lookback, check interval, threshold, hold, recovery threshold, missing-data policy, and channels. Save and return the rule ID/version. Show when Flink applies it. |
- Credentials determine tenant and allowed source. Validate channel ownership before activating a rule.
- Reject malformed batches before publication; return 429 for quota limits and 503 when durable intake is unavailable.
- A timeout may occur after some or all samples reach Kafka. Retry the batch with unchanged sample identities and values. Return success only when every sample is accepted.
- When a sample first enters the system, accept timestamps up to 24 hours in the past and a small tolerance ahead of the current time for clock skew. Replayed samples bypass this check because they were already accepted.
- The query engine converts application query expressions into the database’s query language. PromQL-style expressions require their own translation. Specify whether an average is calculated over time for one host or across several hosts, and how each value is weighted.
Push versus pull and discovery
| Dimension | Push: selected | Pull: alternative |
|---|---|---|
| Reachability | Outbound HTTPS fits firewalls and separate networks. | Collectors must reach each metrics endpoint. |
| Scheduling | Agents control sends; short-lived jobs can report before exit. | Collectors control interval/timeout; jobs can end between scrapes. |
| Debugging / health | Inspect agents, buffers, and collectors; inventory plus heartbeats detects silence. | Inspect /metrics and failed scrapes; timeout does not prove the host itself failed. |
| Discovery | Agents find a collector endpoint; expected inventory remains necessary. | Dynamic target lists and collector ownership are required. |
| Loss / backpressure | Disk buffers and retries help; termination or capacity limits can lose unsent data. | Bound scrape concurrency; missed observations require source-side retention to recover. |
| Operation / trust | Maintain agents, balance collectors, and authenticate source identity. | Shard targets, coordinate handover, authenticate endpoints, and restrict discovery scope. |
For pull, obtain the target list from the orchestration system or a registry such as etcd, Consul, or ZooKeeper. Watch for changes or poll regularly. Include each endpoint, its labels, scrape interval, and timeout. Assign targets using stable IDs to limit reassignment. During a handover, ensure only one collector owns a target. If discovery fails, use the last known list and show its age. New hosts will not appear until discovery recovers.
An agent can scrape local services and push their metrics to the central collector over HTTPS.
9. Key Workflows & Data Flows
Durable ingestion
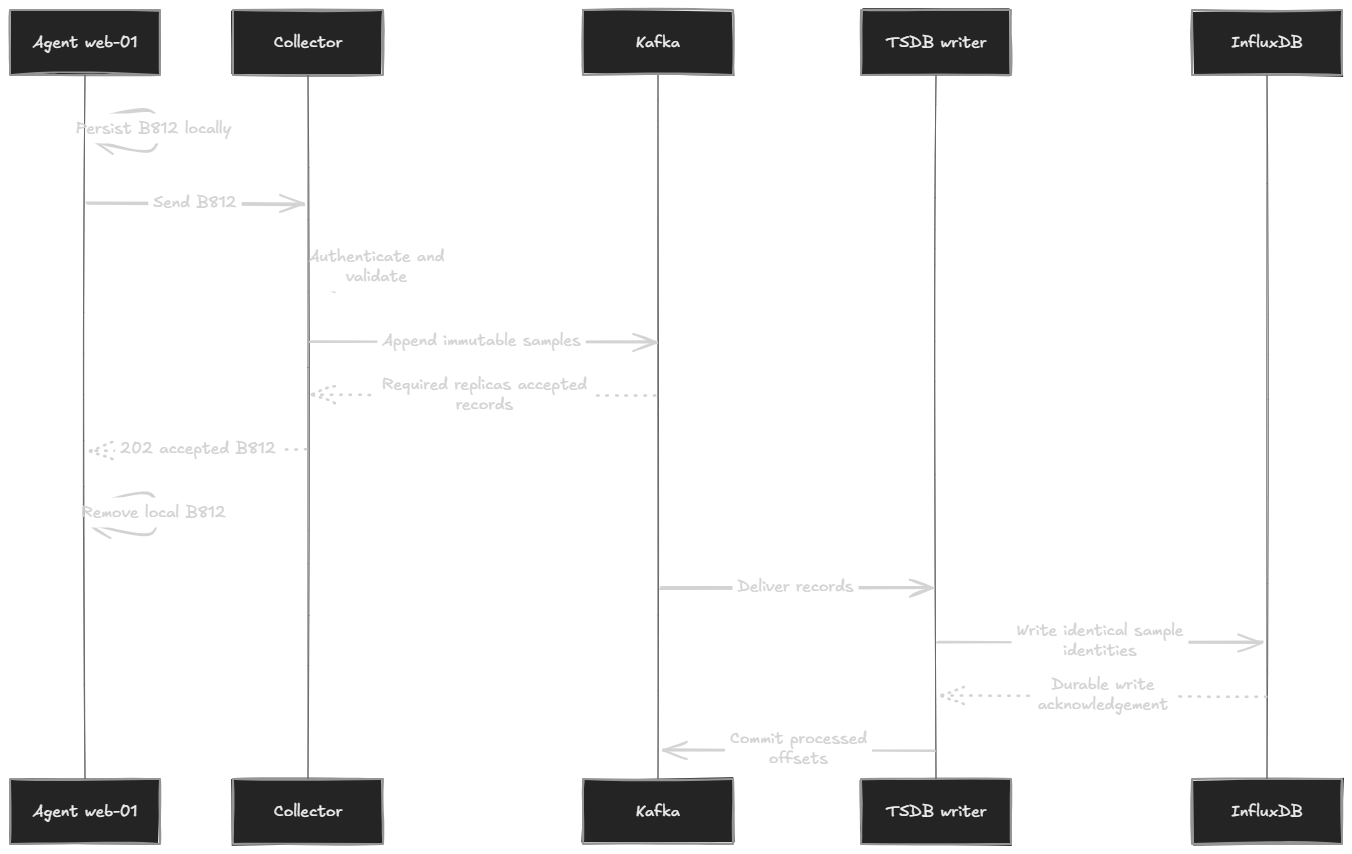
- The agent keeps B812 locally until Kafka confirms replicated storage.
- Writers save samples before committing offsets. Commit only through a continuous sequence of successful writes; do not skip a failed record.
- Flink independently consumes the same metric log. Slow InfluxDB writers do not block its consumer group.
Queries, rule changes, and history
- Dashboard: authenticate the request, select matching series and time ranges, then read the required resolution. Merge results and report missing data and freshness.
- Rule change: save a new version in PostgreSQL. CDC updates Flink, which starts new evidence for the changed rule. Saved and applied versions can differ briefly.
- Alert: check for duplicate samples, finalize ready windows, and update the hold or M-of-N result. Publish a recoverable alert event. Save the incident and jobs together, then send notifications.
- Rollup: rebuild affected time buckets, verify the summaries, and publish them before input data expires. Accepted late samples may require rebuilding older buckets.
10. Technical Deep Dives
10.1 Retries and consistency
An InfluxDB write can succeed before the writer crashes without committing its Kafka offset. Replaying that record is expected.
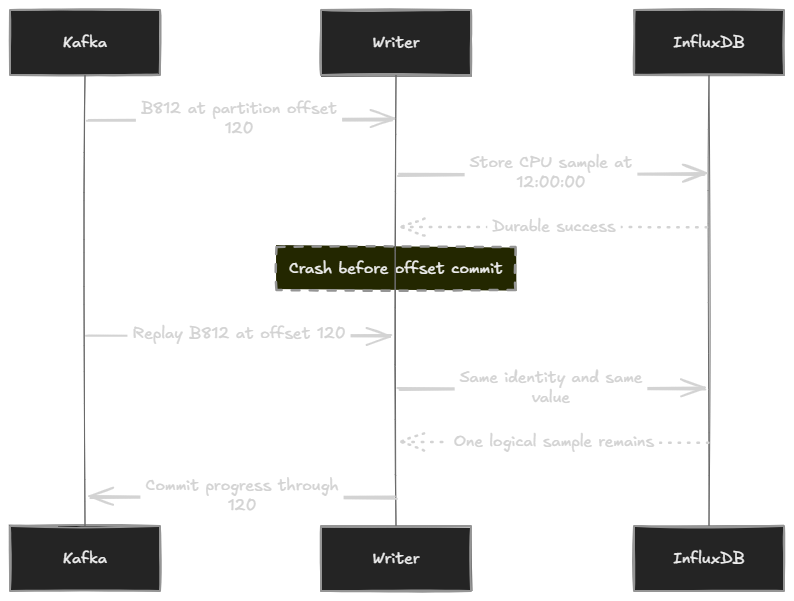
Each sample has an immutable ID. Retries and recovery can deliver that sample more than once, but storage and alert evaluation use the ID to count it only once.
Sample flow:
- On first receipt, check that the sample is within the allowed age. Once accepted, store its ID with the sample.
- Kafka retains the accepted sample for replay. Writers store it in InfluxDB, and Flink checks its ID before adding it to an alert window.
- If a writer or Flink fails, it resumes from its saved Kafka position. Some records can be read again, so the saved ID prevents a duplicate measurement from changing storage or an alert result.
- Keep sample IDs for the live-alert window and correction period. Send older catch-up data to the historical path, where it updates history but does not trigger a live page.
Use a different clock for each rule: the sample’s age at first receipt controls admission, the Kafka append time controls replay retention, and the sample timestamp controls database retention. For example, a sample accepted at 23 hours 50 minutes old may be replayed 30 minutes later because it was already admitted; the 24-hour admission check does not run again.
Consistency model: accepted samples are stored durably, but consumers may receive them more than once. Dashboards see them after writers catch up. Incident changes and delivery jobs commit together. A provider may send a notification more than once.
10.2 Alert evaluation
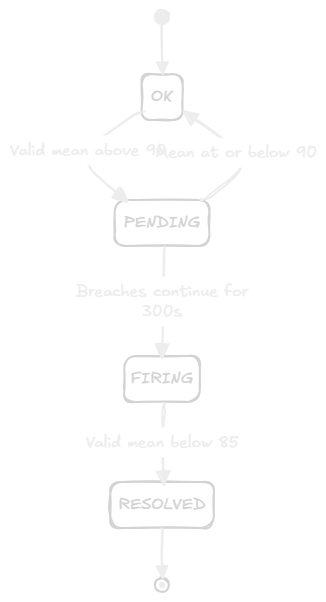
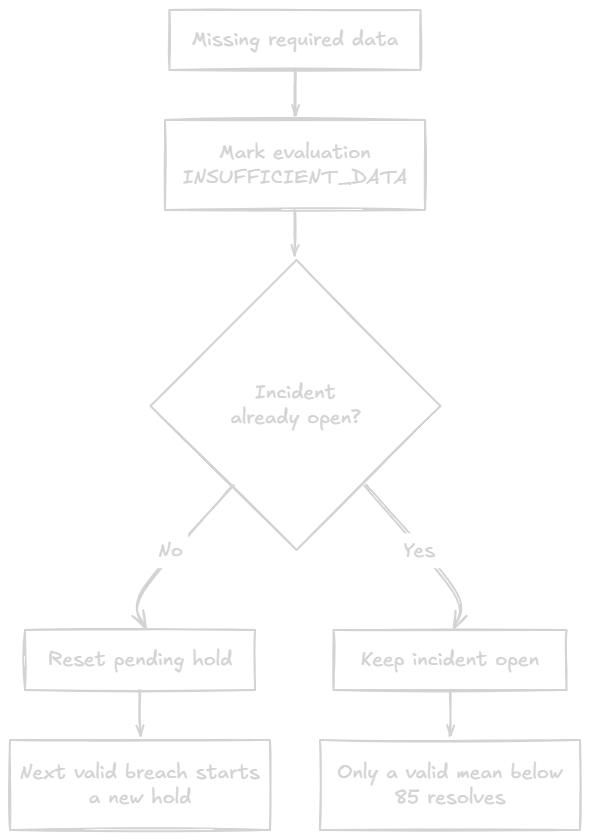
Example CPU alert: tenant acme monitors web-01. Every ten seconds, check its average CPU over the previous minute. Open an incident if that average stays above 90% for five minutes. Resolve it only when a valid average falls below 85%. Missing data cannot prove recovery. The diagrams below show how this rule works.
- Rules: PostgreSQL holds the source rules. Load a snapshot, then apply inserts, updates, and deletes through CDC. Flink’s broadcast state shares rule copies with its workers. Apply versions in a consistent order. Show the version saved in PostgreSQL, the version applied in Flink, and how old the copy is.
- Rule matching: compare each sample’s tenant, metric name, and labels with the rules held locally in Flink. Update the window for each matching rule and host or group. This avoids a PostgreSQL lookup for every sample.
- Partitioned state: keep separate state for each tenant, rule version, and evaluated host or group. Store window summaries, timers, and recent period results. Reuse compatible summaries while keeping each rule’s alert state separate.
- Recovery: restore state and input positions from the same checkpoint. Coordinate writes to the alert-transition topic with checkpoints, or use another output method that recovers failed writes. Give each transition a stable ID so replay cannot create a second incident for the same episode. Flink recovery
- Event time: use the sample timestamp to place it in a window. A watermark estimates how far the stream has progressed in event time. Allow thirty seconds for ordinary out-of-order data. This is not a fixed thirty-second wait after arrival. Handle idle inputs so they do not stall progress, and check heartbeats by receipt time. A watermark does not prove every host reported. Flink watermarks
- Late data: use it to improve historical graphs and rollups. Do not change an alert decision that has already been finalized. Missing or stale evidence resets a pending hold. Checkpoint recovery can preserve the hold only if evidence remains complete and continuous.
Lookback is the time range used to calculate a value. Hold is how long that value must keep breaching the threshold. The CPU rule calculates a one-minute average and requires it to stay above 90% for five minutes. A single five-minute average above 90% does not meet that rule. For example, five period values of 100, 100, 100, 100, and 60 average 92%, but the last period is below the threshold.
At each cutoff T, evaluate the previous minute: [T−60s, T). web-01 reports every ten seconds, so the window needs all six expected samples. If a sample is missing, wait instead of alerting on incomplete data. Fleet rules may allow partial coverage, but must state the required percentage and any excluded hosts.
Sliding window: every ten seconds, move the one-minute window forward by ten seconds. Successive windows overlap for fifty seconds: new samples enter, and samples older than one minute leave. Each evaluation uses the latest complete window, subject to the event-time and coverage rules above.
M-of-N: require six of the last ten one-minute periods to breach, without requiring consecutive breaches. In this separate noisy-CPU example, B means a valid period with CPU above 80%; H means a valid period at or below 80%. Six breaches in B B H B H B B H B H fire the alert. Store each scheduled period once; missing periods occupy their slots and follow the declared missing-data policy. This is separate from the CPU rule’s five-minute continuous hold.
| Missing-data policy | Effect and trade-off |
|---|---|
| BREACHING | Treat silence as a violation; collection failures can trigger metric incidents. |
| NOT_BREACHING | Treat missing data as healthy. This can hide failures or close an incident without recovery evidence. Use only if the rule explicitly permits it. |
| IGNORE | Preserve previous state; do not count missing time toward a continuous hold. |
| INSUFFICIENT_DATA | Report uncertainty. The CPU rule resets pending evidence and preserves open incidents. |
This M-of-N example needs ten valid periods before it decides. Other rules can use a different coverage policy, but must state it. Track expected hosts and alert on missing heartbeats separately. A delay in the monitoring pipeline does not prove every host failed.
10.3 Storage and retention
InfluxDB manages its write-ahead log (WAL), recent data in memory, compressed files, and compaction. The WAL supports recovery. Compaction reorganizes files to improve storage and reads. Writers batch samples, preserve their identities on retry, slow consumption when storage is overloaded, and commit progress after durable writes. Lossless compression reduces bytes. Downsampling replaces raw samples with summaries and permanently removes detail.
| Metric type | Preserve in summaries |
|---|---|
| Gauge | Sum, count, minimum, maximum; choose sample-weighted or equal-host weighting explicitly. |
| Counter | Reset-aware increase and covered duration. |
| Histogram | Counts with compatible bucket boundaries; percentile accuracy remains bounded by those buckets. |
Never average partial means without their counts. For sum/count pairs (90, 1) and (100, 10), the combined mean is 190/11 ≈ 17.3, not 50. Never average host percentiles into a fleet percentile. Histogram aggregation
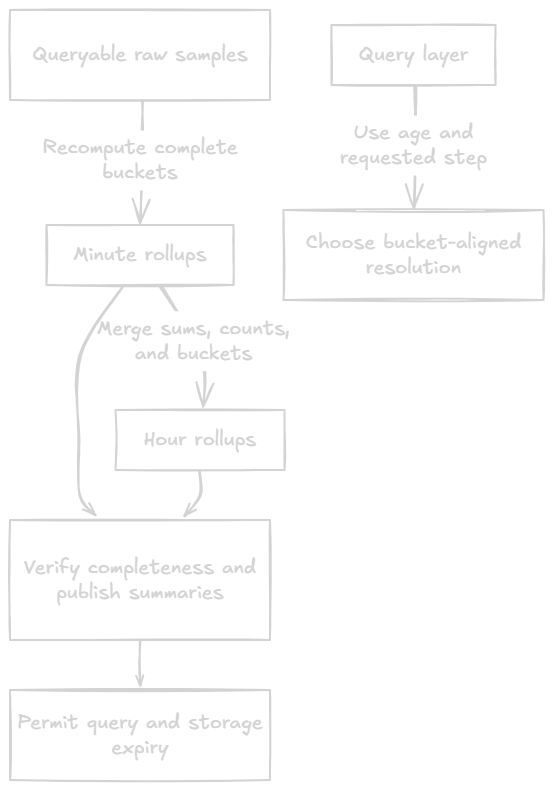
- Build, verify, and publish each summary before its source data expires. Keep its source data queryable and the previous summary readable until publication succeeds; extend retention if rollups fall behind.
- Switch from raw data to minute and hourly summaries only at complete bucket boundaries. Return the actual interval and resolution, because hourly data cannot answer a partial-hour request exactly. Round or reject requests that need exact boundaries. An hourly maximum shows that a spike occurred, not when; retain raw data longer if investigations need that detail.
10.4 Notification delivery
When an alert starts firing, Flink emits a state-change event, or transition, with a stable ID. The notification service checks for duplicates. It then saves incident I42 and one job per channel in a single PostgreSQL transaction. This transactional outbox ensures the incident and its required delivery jobs are saved together.
Commit the alert-topic offset only after the incident and jobs are saved. A crash before the offset commit can cause replay. The stored transition ID prevents duplicate incidents and jobs.
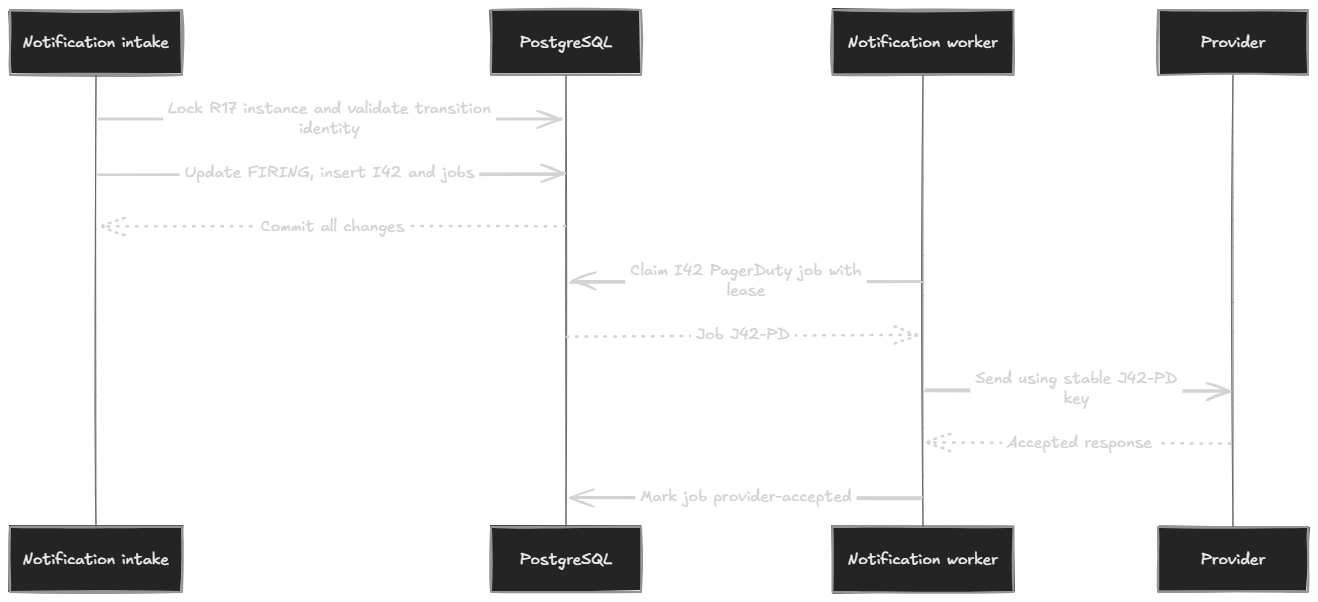
The provider’s acceptance confirms that it received the notification, not that an engineer read or acknowledged it.
- A worker claims a job for a limited time, called a lease. If it fails, another worker can claim the job after the lease expires.
- Redis speeds up duplicate checks and grouping. If a key is missing, check PostgreSQL. Cache entries must not replace delivery jobs or hide unfinished work.
- Retry temporary failures with increasing delays (backoff) and a random variation (jitter). Respect provider rate limits. Invalid credentials or channels need a visible failure and operator action.
- Group related host incidents. Give each silence a scope and expiry time, and keep escalation active. Send an incident’s opening and resolution notifications in order.
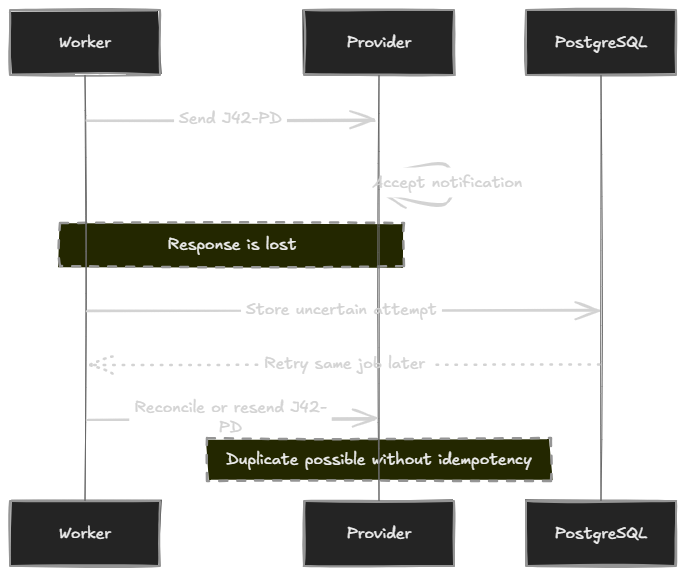
Use the same job ID on retry. If the provider supports idempotency, it can recognize that ID and avoid a second send, subject to its retention period and scope. Check delivery status when possible before resending an uncertain attempt. Without that support, retries can send duplicates. This design cannot promise exactly-once notification delivery.
11. Scalability and reliability
Spread work across partitions
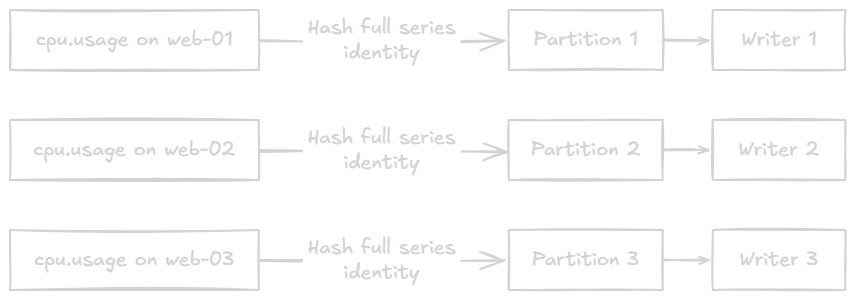
- Hash the tenant and full series identity—metric name plus source labels—to choose a Kafka partition. This spreads load across partitions while keeping every sample for one series in order. Hashing only
cpu_usagewould send every host’s CPU samples to one partition. - One member of a consumer group reads a partition at a time. Writers and Flink use separate groups, so both can process every accepted sample independently.
- Kafka preserves the order in which records enter a partition, not timestamp order. Late samples can still arrive out of order, so InfluxDB and Flink handle them by timestamp.
- Flink keeps state by host or evaluated group. For fleet rules, workers calculate partial summaries and merge them, instead of sending all raw fleet data to one overloaded worker.
Bound the workload: prevent one tenant or query from exhausting the system. Cap label cardinality and series per tenant, limit query time ranges, result size, and concurrency, and isolate capacity for ingestion, dashboards, and Flink. Reserve capacity for critical metrics; cache only queries that are repeatedly used.
Durability and recovery: Kafka replicates accepted samples across failure zones and accepts writes only after enough in-sync replicas acknowledge them. Agents buffer temporary outages, and writers commit Kafka progress only after InfluxDB confirms storage. Database replicas and backups protect history after Kafka’s replay period ends. Monitor partition imbalance, checkpoint time, backlog drain rate, series count, and query fan-out to plan capacity.
12. Design Trade-offs & Alternatives
| Decision | Selected approach | Cost / alternative |
|---|---|---|
| Collection | HTTPS agent push | Agent maintenance and buffers; pull suits reachable targets and central scrape control. |
| Ingestion | Replicated Kafka | Another system to operate, with limited retention. A durable collector queue can suit a small fleet. |
| Metrics storage | InfluxDB | Check the selected edition’s query and durability support. Cassandra gives more storage control but needs more custom query logic. |
| Alert evaluation | Flink consumes Kafka independently | Requires rule CDC, state management, and checkpoint operation. Scheduled TSDB queries are simpler if alerts can wait during storage outages. |
| State and suppression | PostgreSQL incidents/jobs plus Redis for fast, temporary checks | Delivery depends on PostgreSQL transactions. Redis speeds up rate-limit, grouping, and duplicate checks, but cannot by itself prevent lost or repeated pages. |
| History | Recent raw data, then verified rollups | Requires background jobs. Summarizing before ingestion reduces traffic but loses raw detail. Summarizing at query time requires larger scans. |
| Retention | Database-managed compression and S3/GCS persistence | Compression savings depend on the data. Summaries reduce record count but lose time detail. |
| Querying | Query engine with enforced limits; optional cache | Another service and cache to operate. Built-in TSDB and Grafana integrations may suffice. |
Kafka Streams runs as a library inside an application. It can suit a Kafka-based system and avoids a separate Flink cluster. Flink provides a dedicated processing platform with managed state and checkpoints. Either choice needs clear rules for windows, rule updates, late data, and recovery. A custom consumer requires more work to build these mechanisms. All three still need safe alert publication and recoverable delivery jobs.
13. Bottlenecks, Edge Cases & Failure Scenarios
| Failure / bottleneck | Effect | Recovery and remaining limit |
|---|---|---|
| Acceptance response lost | Agent retries an accepted batch. | Repeat immutable samples; extra work is acceptable. |
| Writer crashes after persistence | Kafka replays a successful write. | Same identity/value preserves one logical sample. |
| InfluxDB outage | Dashboard history becomes stale; Flink may remain current. | Drain writer backlog after recovery. Alert dependencies remain separate. |
| Flink failure / checkpoint stall | Live evaluation pauses while storage may continue. | Restore state and input positions together. Old catch-up data cannot establish a current continuous breach. |
| PostgreSQL outage / CDC lag | Rule copies can become stale. A PostgreSQL outage also blocks new incident/job commits. | Buffer alert events within retention. Apply the stale-rule policy and resume saved work after recovery. Previously started sends may have unknown outcomes. |
| Redis outage | Rate-limit checks or notification cache lookups fail. | Follow the stated intake policy. Recover notifications from PostgreSQL. Do not silently bypass strict quotas. |
| Missing host / late data | Live evaluation lacks data. Late samples can improve history. | Use inventory and heartbeats to detect missing hosts. State how much coverage is required and how late data is handled. |
| Rollup failure | Source data may expire before summaries are ready. | Extend retention while the source is still queryable. Retry publication and allow extra storage space. |
| Too many series / hot partition | Metadata storage or one worker reaches capacity. | Reject uncontrolled labels, enforce tenant limits, adjust sampling, and check for uneven partition or key load. |
| Wide queries / notification surge | Queries contact too many nodes or delivery queues grow. | Limit scans, merge partial results, group pages, prioritize jobs, and escalate. Mark incomplete results clearly. |
During a PostgreSQL outage, Flink may continue with existing rule copies if the stale-rule policy permits it. New incidents and delivery jobs must wait. Workers stop new provider calls if they cannot confirm a valid lease. Intake and queries continue only if their authentication and admission checks still work.
Monitor the platform from an independent health service. If Flink stops, another system must report that failure.
14. Observability, Monitoring & Alerting
| Signal | Decision it supports |
|---|---|
| Age of oldest unwritten record since Kafka append | Restore writers or add capacity before the replay period ends. |
| Arrival rate versus writer rate | Estimate how fast the backlog can drain. A working database does not mean writers can catch up. |
| Flink lag, watermark, checkpoint age, and coverage | Restore processing or rebalance uneven load. A healthy database does not prove alerts are current. |
| Saved versus applied rule version | Repair CDC or reload a consistent snapshot so Flink uses the intended rules. |
| Oldest critical job, provider errors, permanent failures | Retry, repair credentials, switch channel, or escalate. |
| Time until source data expires for unfinished rollups | Extend retention before the source becomes unqueryable. |
| New/rejected series and per-tenant query cost | Fix sources that create excessive series and limit tenants that consume too many resources. |
15. Capacity, Recovery & Storage Reference
Additional reference details.
A. Capacity and recovery
| Follow-up | Key point |
|---|---|
| Retained storage | Raw: 3.63 TB; minute summaries: 1.99 TB; hourly summaries: 0.48 TB. Total: 6.1 TB logical, assuming 150 bytes per record. |
| Larger summaries | At 250 bytes per summary, total storage becomes 7.74 TB logical. Add replication, indexes, compaction, and recovery space. |
| Kafka capacity | One day at baseline with three replicas needs about 1.56 TB, before overhead. Disk and byte limits must support the promised replay period. |
| Backlog recovery | Drain time = backlog / (writer rate − arrival rate). Writers must process faster than new samples arrive. |
| Flink sizing | A one-minute buffer for 400,000 series holds 2.4M observations: 360 MB logical. Rule state, timers, deduplication, checkpoints, and recovery need additional capacity. |
B. Storage and compression
- Columnar storage: group values by field. Read only needed columns and time ranges to reduce disk work.
- Recovery and compaction: the WAL records writes for recovery. Compaction reorganizes stored files to reduce read and storage cost. These are database responsibilities.
- Compression: delta-of-delta encoding stores changes in the intervals between timestamps. XOR encoding stores differences between consecutive float bit patterns. Regular timestamps and similar values compress well; noisy data compresses less well. Both methods preserve the samples. Check support in the deployed InfluxDB edition.
- Downsampling: replace samples with summaries. Keep sums and counts for averages. For counters, keep increases that account for resets. For histograms, keep counts with compatible bucket boundaries. Do not average host percentiles.
- Cassandra alternative: supports distributed writes, but needs more custom metric-query and rollup logic. Compaction consumes I/O; late writes complicate time-window retention.
- Retention safety: publish and verify rollups before raw data expires. Extend retention before expiry if rollups fall behind; files still on disk may no longer be queryable.
16. Key Takeaways
Core design takeawaysReview the five paths before moving on to the quiz.Show summaryHide summary
Metrics Monitoring System
Review the five paths before moving on to the quiz.
Write PathFrom agent samples to durable, replay-safe storage
Agent batching and HTTPS push
Ingestion gateway
Durable acceptance in Kafka
TSDB writers and InfluxDB
Retries and deduplication
Read PathFrom dashboard requests to honest historical results
Dashboard query request
Query engine
Response and data quality
Rule PathFrom a rule edit to the version running in Flink
Versioned rule changes
CDC and broadcast state
Checkpoint recovery
Alert PathFrom stream evidence to incidents and notifications
Flink real-time evaluation
Alert lifecycle
Missing-data policies
Reliable notification delivery
History PathFrom raw measurements to verified long-term summaries
Storage and compression
Downsampling and rollups
Retention schedule
17. Knowledge Check
Can you keep metrics and alerts reliable?
Choose one answer per scenario. Each answer reveals an explanation.
An agent submits Batch B812, but the HTTP response is lost before reaching the agent. How does ingestion ensure durable acceptance and prevent duplicate logical measurements when the agent retries?